New in Symfony 3.1: Web Debug Toolbar and Profiler Enhancements
In Symfony 3.1, the Web Debug Toolbar and the Profiler have introduced lots of new features. The major new features will be explained in upcoming blog posts, so in this article we'll focus on smaller but useful changes that will improve your day-to-day work.
Show silenced error logs separately
Contributed by
Peter Rehm
in #16760.
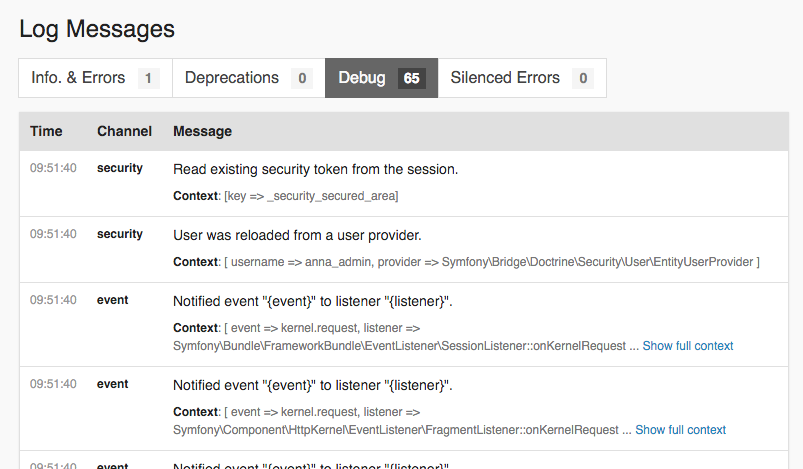
The log panel of the Symfony Web Debug Toolbar separates messages into three groups: deprecated calls, silenced errors and the rest of messages. However, in the Symfony profiler, the silenced errors were mixed with other types of logs.
In Symfony 3.1, the logs of the silenced errors are displayed in a separate tab, so you can easily focus on them when needed:

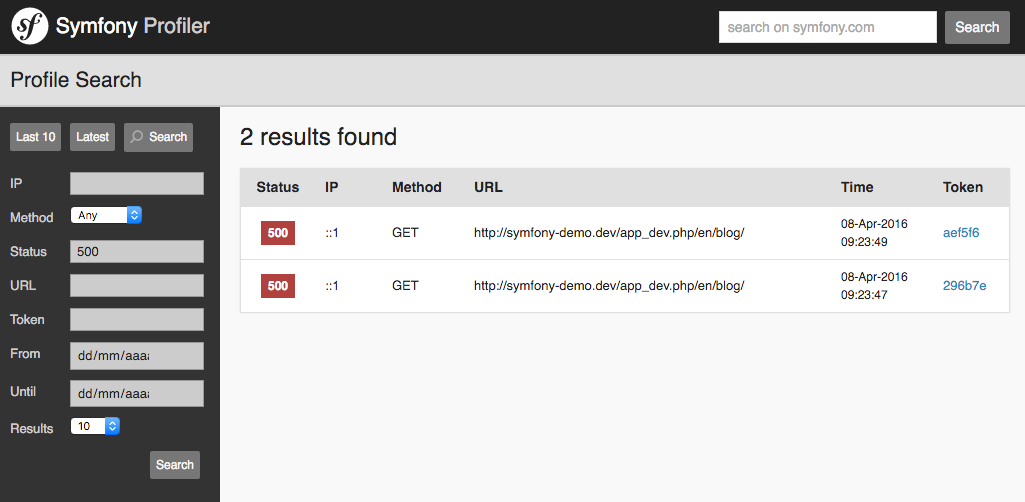
Look for profiles based on their HTTP status
Contributed by
Sébastien Bramille
in #17125.
The Symfony Profiler includes a search feature to look for past profiles based on several conditions: IP, HTTP method, URL, etc. Oddly enough, it wasn't possible to look for profiles based on their HTTP status. In Symfony 3.1 this is now possible:
Improved how log contexts are displayed
Contributed by
Javier Eguiluz
in #17852.
Log messages commonly include metadata to provide some context about where they were generated. In the Symfony Profiler this information is inlined bellow each log message. However, when the context is long or complex, the result is barely intelligible.
In Symfony 3.1 we improved the way complex log context are displayed. Initially you only see the beginning of the context and when clicking on the "Show full context" link you'll see the full context contents properly formatted:

In order to improve your productivity, this is only enabled for long contexts. The rest of log contexts are fully inlined:
Displayed the HTTP status code for Ajax requests
Contributed by
Jakub Kucharovic
in #17540.
The Symfony Web Toolbar displays in real-time the Ajax requests performed by your Symfony application. Each request displays the HTTP method, the URL, the execution time and a link its profile. In Symfony 3.1, this panel now also displays the color-coded HTTP status, so you can instantly filter errors from regular requests:

About us
What a Symfony developer should know about the framework: News, Jobs, Tweets, Events, Videos,...
- Welcome to Symfony News !
- More About us
- Contact us on contact[at]symfony-news.com